
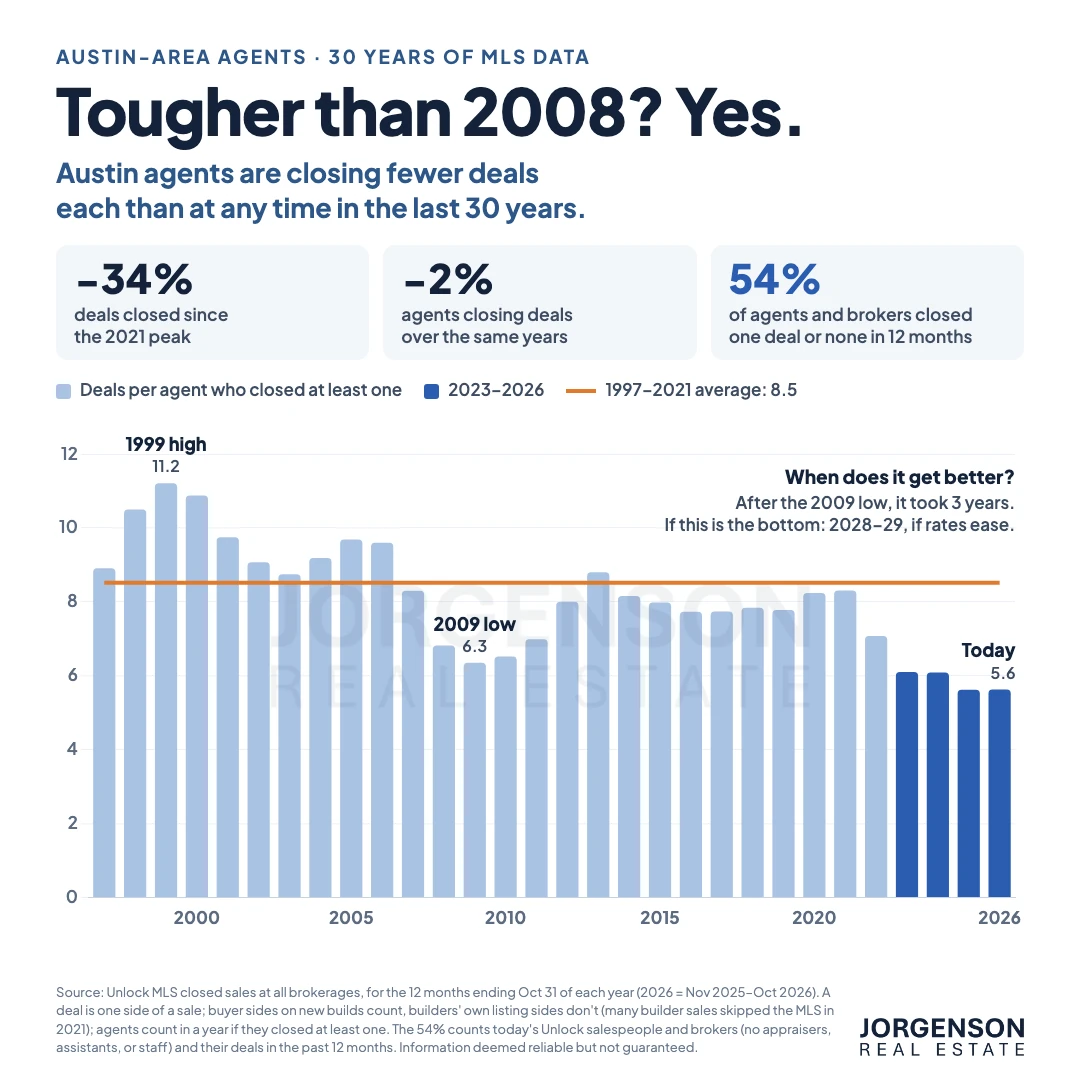
The short version: Austin-area agents who closed a deal averaged 5.6 deals in the past 12 months (counting buyer sides on new builds, not builders’ own listing sides). The last four years are the four lowest in 30 years of Unlock MLS data, below even the 2009 low of 6.3. Deals are down 34% since 2021, the same drop as 2008–09, but the number of agents closing them is down only 2%, vs. 14% then. Falling prices, the fewest resales since 2012, more business going to the top 10% of agents, and inflation make it feel even harder. If 2025–26 is the bottom, the 2009 recovery path points to real relief in 2028–29, if rates ease.
Inman ran a piece this week asking whether this is the toughest housing market in 30 years. One broker with three decades in the business said these last four years have been harder than 2008. I wanted to know if that holds up here, so I pulled 30 years of Austin-area MLS data. By the measure that matters most to agents, it does.
Some Numbers Aren’t That Bad
Before the hard part, here’s what’s actually holding up:
- Homes are still selling. About 28,000 single-family homes sold in the Austin metro in the past 12 months. That’s more than any year before 2016.
- Prices are still up. The median sale price is about $430K, 35% higher than in 2019.
- Jobs are fine. Austin has 27% more jobs than in 2019, and unemployment is about 3.7%.
- Fewer listings fail than in 2009. About one in three listings ends without a sale today. In 2009 and 2010, it was nearly half.
So why does it feel so hard? Here’s what the data says.
1. More Agents Are Splitting Fewer Deals
Deals closed in Unlock are down 34% since 2021. The number of agents closing them is down 2%. That’s the whole story in two numbers.
In 2008 and 2009, deals fell the same 34%, and the number of agents closing them fell 14%. A lot of people left the business, and the ones who stayed split what was left. This time, almost nobody left.
So agents who closed at least one deal averaged 5.6 in the past 12 months. Even the 2009 low was 6.3. That counts an agent who brought the buyer on a new build, but not the builder’s own listing side (more on builders below). Half of agents who closed a deal closed one or two. Count every agent and broker in Unlock (not the appraisers, assistants, and staff who also subscribe), and 54% closed one deal or none in the past 12 months. 38% closed none.
2. Austin Grew, but Home Sales Didn’t
Austin added jobs and people for four straight years while home sales went sideways. Measured against the size of the job market, resales just had their four slowest years in 30 years, slower than anything in 2009 to 2011. After 2008, the slowest stretch lasted three years before it turned. This one is in year four.
3. Prices Are Falling, and Austin Isn’t Used to That
In 2008, Austin prices barely moved. The median actually rose from $176K in 2006 to $195K in 2011. This time, it’s down 17% from $515K in 2022. After inflation, it’s down 27%, and only about 4% above 2019.
Sellers remember 2022. That’s why 53% of homes that sold in the past 12 months closed at least 5% below their first list price, the highest share in 30 years. The typical home took 48 days to go under contract. In 2021, it took 5.
4. Inflation Took a Bite
The dollar volume closed by the typical producing agent is down 22% from 2021. After inflation, it’s down 37%, while gas, dues, marketing, and everything else cost more.
5. The Deals Are Bunching Up at the Top
Over the last four years, the top 10% of agents closed about half of all deals. In the early 2000s, it was about 40%. So if you’re in the middle of the pack, your year probably looks worse than the market averages do.
6. Resales Fell Further Than the Totals Show
In the MLS, new construction looks like a record share of sales right now. Don’t read too much into that. In 2021, builders sold a ton of homes without ever putting them in the MLS, and now they list almost everything, so the MLS can’t really measure their share. That’s why the deal counts in this post leave out the builder’s own listing side but count it when an agent brings the buyer.
Resales are the cleaner measure, because they almost always go through the MLS. And they’re the bread and butter for most agents. Resales fell to about 20,800 in the past 12 months, the fewest since 2012 and 37% fewer than in 2021. Owners sitting on 3% mortgages are staying put, and builders buying down rates pull buyers their way.
7. We’re Comparing It to the Best Years Ever
2020 and 2021 were the busiest years in Austin history. Homes went under contract in days, over asking. That’s the yardstick in everyone’s head, including mine. Next to that, a normal year would feel slow. This isn’t a normal year.
What Moves Together
I ran the numbers year by year, back to 2003. A few things stood out:
- Mortgage rates track how hard each deal is, more than how many homes sell. Higher-rate years had longer days on market and more homes selling well under their first price. Rates have averaged 6.5–6.8% for four years, the highest since the early 2000s.
- Price levels alone barely track how many homes sell. It’s the mix of prices, rates, and owners who won’t give up a low rate.
- The more agents there are, the more the business piles up at the top. Of everything I checked, those two moved together the most closely.
These are patterns, not proof of cause and effect. But they all point the same way.
When Does It Get Better?
Here’s the honest, data-based answer. After the 2009 low, deals per agent took three years to get back to normal: 6.3 in 2009, 8.0 by 2012. Two things did the work. Mortgage rates fell from about 5.2% to 3.8%, and about 15% of agents left the business.
This time, deals per agent were 5.6 in 2025 and 5.6 again in the past 12 months. That looks like a floor, but one flat year isn’t proof. If this is the bottom, the same three-year path says agents feel real relief in 2028 or 2029. Windermere’s chief economist points to about 2028 for the market to turn.
But I’d call that the hopeful case. Neither thing that fixed 2009 is happening yet. The 30-year rate is 7.11% this week, up from 6.24% a year ago, and agents aren’t leaving. If rates ease, 2028–29 holds. If they don’t, relief comes later, and it comes one closing at a time.
What I’d Take From This
It isn’t just you. The slice of the pie per agent is the smallest it’s been in at least 30 years. If your year feels thin, the math explains a lot of it.
Price it right the first time. More than half of homes are selling 5% or more under where they started. Every week a listing sits costs your seller, and it costs you.
Plan for more of the same in 2027. Windermere’s chief economist told Inman he expects more inventory and flat prices next year. The agents who come out strong will be the ones who keep working their people now.
Why This Matters If You’re an Agent
At JRE, numbers like these aren’t a once-a-year speech. Every Texas agent here sees Market Health for their own area, and every listing in our portal shows how homes nearby sold at each price, so the pricing conversation starts with real data. If that’s how you want to work in a market like this one, let’s talk. You can also see the rest of the platform.
Source: Unlock MLS closed sales, all brokerages, for the 12 months ending October 31 of each year, 1997–2026 (2026 = November 2025–October 2026). Deals are transaction sides; agents count in a year if they closed at least one. Austin-metro figures are single-family homes in Travis, Williamson, Hays, Bastrop, and Caldwell counties. Deals leave out the builder’s listing side on new construction; buyer sides on new builds count. Resales are sales not flagged as new construction. Agent shares count today’s Unlock salespeople and brokers (no appraisers, assistants, or staff) and their deals in the 12 months ending October 31, 2026. Inflation: U.S. Bureau of Labor Statistics CPI. Jobs: BLS, Austin–Round Rock–San Marcos metro. Mortgage rates: Freddie Mac 30-year fixed. Information deemed reliable but not guaranteed.
Sources
- Unlock MLS closed sales, all brokerages, 1997–2026 (12 months ending October 31)
- U.S. Bureau of Labor Statistics: CPI-U and Austin–Round Rock–San Marcos nonfarm jobs
- Freddie Mac Primary Mortgage Market Survey (30-year fixed)
- Inman: Toughest housing market in 30 years? What the data and pros say (Nov. 18, 2026)
General information, not legal advice. TREC says I can’t practice law, and I like my license. Run your specific situation past your broker or a real estate attorney.
← All Broker Notes · Get The Debrief monthly → · Talk with us →